
ブラウザ上で動作するtradingviewのlightweight-chartsは使いやすくて高機能で自前でチャートシステム作りたい人には最高なのですが、意外とサンプルコードが少なく、わかりづらかったりします。
今回は垂直線とラベルを表示するコードを作成してみたいと思います。
ISeriesPrimitiveBaseインターフェースを利用して実装してあります。
サンプルプラグインで機能は満たせるのですが、1本描画しか対応していなので複数描画に対応したバージョンにしたいと思います。以下はモジュールとしてimportするコードになります。
vertical-line.js
const VertLineDefaultOption = {
    time: null,
    text: "sample text",
    info: "sample info",
    textColor: "black",
    bgColor: "white",
    showLabel: true,
    lineColor: "white",
    lineWidth: 2,
}

export class VertLine {
    constructor(chart, series, timeLabelInfoArray) {
        this._chart = chart;
        this._series = series;
        this._paneViews = new Array();
        this._timeAxisViews = new Array();
        timeLabelInfoArray.forEach((timeLabelInfo, i) => {

            const vertLineOptions = { ...TimeLabelInfoDefaultOption , ...timeLabelInfo };
            if (vertLineOptions.time === null) {
                throw Error("timeLabelInfo must specify a time key.");
            }
            this._paneViews.push(new VertLinePaneView(this, vertLineOptions));
            this._timeAxisViews.push(new VertLineTimeAxisView(this, vertLineOptions));
        });
    }

    updateAllViews() {
        this._paneViews.forEach(pw => pw.update());
        this._timeAxisViews.forEach(tw => tw.update());
    }

    timeAxisViews() {
        return this._timeAxisViews;
    }

    paneViews() {
        return this._paneViews;
    }
    getTimeAxisViewOnMouse(param) {
        const data = new Array();
        this._timeAxisViews.forEach((timeAxisView, i) => {
            if (timeAxisView.time() == param.time)
                data.push(timeAxisView);
        });
        return data;
    }
}


function positionsLine(positionMedia, pixelRatio, desiredWidthMedia = 1, widthIsBitmap) {
    // メディア座標をピクセル単位に変換
    const scaledPosition = Math.round(pixelRatio * positionMedia);
    // 線の幅をピクセル単位で計算(widthIsBitmapが真の場合は変換せずにそのまま使用)
    const lineBitmapWidth = widthIsBitmap ? desiredWidthMedia : Math.round(desiredWidthMedia * pixelRatio);
    // 線を中央に配置するためのオフセットを計算
    const offset = Math.floor(lineBitmapWidth * 0.5);
    // 線の開始位置を計算
    const position = scaledPosition - offset;
    // 開始位置と線の幅を含むオブジェクトを返す
    return { position, length: lineBitmapWidth };
}


class VertLinePaneRenderer {
    constructor(x, options) {
        this._x = x;
        this._options = options;
    }

    draw(target) {
        if (this._x === null) return;
        target.useBitmapCoordinateSpace(scope => {
            const ctx = scope.context;//CanvasRenderingContext2D
            const position = positionsLine(this._x, scope.horizontalPixelRatio, this._options.lineWidth);
            ctx.fillStyle = this._options.lineColor;
            //チャート上に縦線を描画するコード
            ctx.fillRect(position.position, 0, position.length, scope.bitmapSize.height);
        });
    }
}

class VertLinePaneView {
    constructor(source, options) {
        this._source = source;
        this._options = options;
        this._x = null;
    }

    update() {
        const timeScale = this._source._chart.timeScale();
        this._x = timeScale.timeToCoordinate(this._options.time);
    }

    renderer() {
        return new VertLinePaneRenderer(this._x, this._options);
    }
}

class VertLineTimeAxisView {
    constructor(source, options) {
        this._source = source;
        this._options = options;
        this._x = null;
    }

    update() {
        const timeScale = this._source._chart.timeScale();
        this._x = timeScale.timeToCoordinate(this._options.time);
    }

    visible() {
        //領域外にはみ出したら消去する
        if (this._x <= 0 || this._x >= this._source._chart.paneSize().width)
            return false;
        else
            return this._options.showLabel;
    }

    tickVisible() {
        return this.visible();
    }

    coordinate() {
        return this._x ?? 0;
    }

    time() {
        return this._options.time;
    }

    text() {
        return this._options.text;
    }

    info() {
        return this._options.info;
    }

    textColor() {
        return this._options.textColor;
    }

    backColor() {
        return this._options.bgColor;
    }


}
メインコード
let chart = LightweightCharts.createChart(document.body, { width: 500, height: 500 });
const data = [
{ time: '2018-12-22', open: 75.16, high: 82.84, low: 36.16, close: 45.72 },
{ time: '2018-12-23', open: 45.12, high: 53.90, low: 45.12, close: 48.09 },
{ time: '2018-12-24', open: 60.71, high: 60.71, low: 53.39, close: 59.29 },
{ time: '2018-12-25', open: 68.26, high: 68.26, low: 59.04, close: 60.50 },
{ time: '2018-12-26', open: 67.71, high: 105.85, low: 66.67, close: 91.04 },
{ time: '2018-12-27', open: 91.04, high: 121.40, low: 82.70, close: 111.40 },
{ time: '2018-12-28', open: 111.51, high: 142.83, low: 103.34, close: 131.25 },
{ time: '2018-12-29', open: 131.33, high: 151.17, low: 77.68, close: 96.43 },
{ time: '2018-12-30', open: 106.33, high: 110.20, low: 90.39, close: 98.10 },
{ time: '2018-12-31', open: 109.87, high: 114.69, low: 85.66, close: 111.26 },
];
const candlestickSeries = chart.addCandlestickSeries();// シリーズを追加
candlestickSeries.setData(data); // データを設定
const lineSeries = chart.addLineSeries();
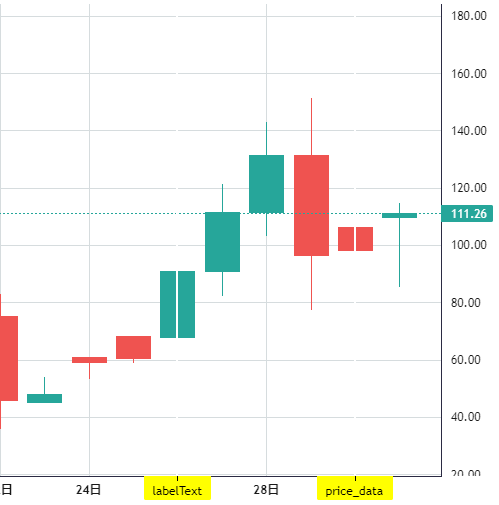
const timeLabelInfoArray = [
{ time: data[data.length - 2].time, text: "price_data", info: "参考情報", bgColor: "yellow" },
{ time: data[data.length - 6].time, text: "labelText", info: "参考情報", bgColor: "yellow" }
];
const vertLine = new VertLine(chart, lineSeries, timeLabelInfoArray);
lineSeries.attachPrimitive(vertLine);timeLabelInfoは以下のパラメータを設定できるようにしてあります。infoは情報格納するための変数で特に意味ありません。time keyのみ必須にしてあります。
const TimeLabelInfoDefaultOption = {
    time: null,
    text: "sample text",
    info: "sample info",
    textColor: "black",
    bgColor: "white",
    showLabel: true,
    lineColor: "white",
    lineWidth: 2,
}
出来上がりはこんな感じになります。よく見たら垂直線が白線になっててよく見えません。lineColorを変えてやってください。(直せよ。。。)お疲れ様でした。

コメント